
Reports is the main dashboard in AVA® Portal. It shows your leads, your revenue, your campaigns, and your product usage on one page.
It started as a way for dealer groups to see every store together instead of opening each one separately. While we were in there we rebuilt the reporting for single stores too. So this is not a group feature. Every dealership gets a better dashboard, whether you run one rooftop or ten.
Reports replaces the Overview page. Going forward there is one dashboard for everyone.
Open it here: log in to AVA® Portal and select Reports in the navigation menu.
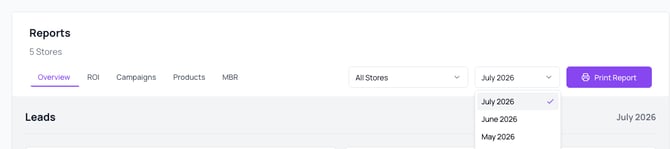 Caption: Everything you need sits in one row at the top of the page.
MBR tab painted out of this version. Dealer group view, shows the Products tab.
Who can see Reports
| User type | Access |
|---|---|
| Company Admin, single store | Yes |
| Company Admin, dealer group | Yes, plus all-store and per-store views |
| Member user | No access to the Reports tab |
If someone on your team needs to see Reports, their user role needs to be Company Admin. Contact your Autocorp representative to change a role.
Which tabs you will see
| Tab | Single store | Dealer group |
|---|---|---|
| Overview | Yes | Yes |
| ROI | Yes | Yes |
| Campaigns | Yes | Yes |
| Products | Not in this release | Yes |
Products compares product usage across stores, so it only appears for dealer groups in this release.
The two filters at the top
Everything on the page responds to two controls.
Month picker. Select the month you want to see. Every chart, table, and number updates to that month.
Store picker. Choose All Stores to see the group rolled up, or select one store to see it on its own.
Single store dealers still see both controls. Tables like Store Comparison simply collapse down to your one store instead of showing a ranked list.
What is on each tab
Overview
Your general health check.
- Leads Created. How many leads came in, broken out by the tool that generated them: credit application, trade-in valuation, test drive booking, ID verification, and more, shown over time.
- Lead Status. Where each lead stands right now: new, working, contacted, appointment booked, sold, or dead.
- Average Credit Scores. Your average applicant credit score. For groups, stores with more applicants carry more weight in the average, so one store with a couple of applications cannot swing the group number.
- Leads Summary. Total leads, how many have not been opened yet, and how many came from your team reaching out versus the customer reaching in.
- Campaign Pipeline. How many campaigns are active or still in draft.
- Most Active Users. Two leaderboards showing who is logging in most, one for AVA® Portal and one for AVA® Co-Driver.
- Top Sources. Which channels and campaigns are producing the most leads overall, and specifically for credit and trade-in.
- Store Lead Comparison. For groups, every store side by side, with a link into the full detail view for any one of them. For single stores, this collapses to your one store.
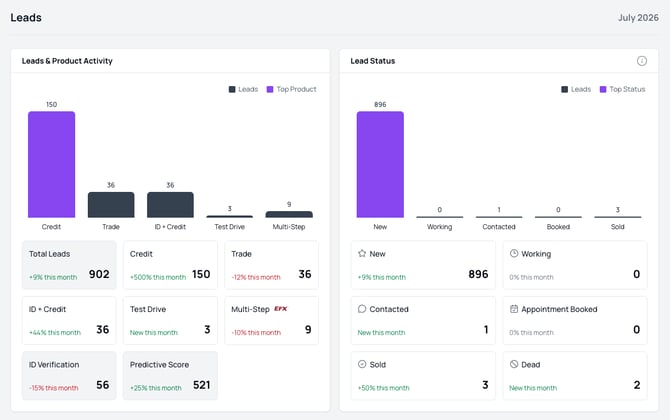
Caption: Leads by the tool that created them, next to where each lead stands right now.
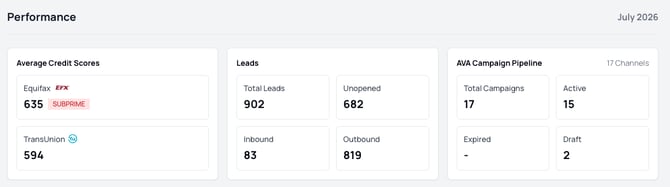
Caption: Average credit scores, your leads summary, and campaign pipeline at a glance.
HOLD: check TransUnion announcement sequencing, or drop this image.
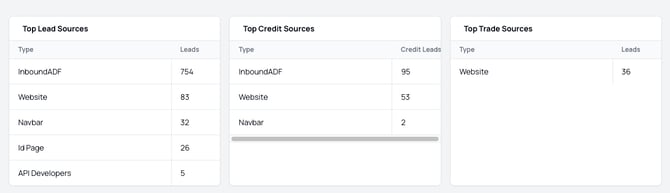
Caption: Top sources broken out overall, for credit, and for trade-in.
ROI
The money story.
- Headline numbers. Additional revenue, your conversion rate, how much your lead volume has grown, and estimated profit per vehicle sold.
- Conversion Funnel. How leads move from arrival through each product step down to sold, with a percentage at every stage. This is the fastest way to see where deals are dropping off.
- Campaign Attribution. Which specific campaigns produced which results.
- Store ROI. For groups, each store's conversion rate and revenue against the group average, so over and under performers are obvious at a glance.

Caption: The ROI headline tiles. Note the caption under Additional Revenue: it tells you whether the figure is measured or estimated.
Single store clients will not see an up or down comparison arrow on Store ROI, because there is no group average to compare against.
Campaigns
Campaign performance, a top ten campaigns leaderboard, and a searchable table. Filter by status, type, or assignee. There is a Create AVA® Campaign button here too.
Products
Dealer groups only in this release. Shows which AVA® tools each store is actually using.
- Distribution Overview. For each product, the percentage of your stores using it. This is your "what still needs turning on" view.
- Product Comparison. Store by store usage per product. A dash means the product is not enabled at all. A zero means it is enabled but has not been used yet.
Exporting with Print Report
Select Print Report at the top right to turn the current view into a PDF you can send or print.
You choose:
- The reporting period (month)
- Which stores to include, if you have more than one
- Which sections to include: Store Comparison, Overview, ROI, AVA® and UTM Campaigns, and Products where available
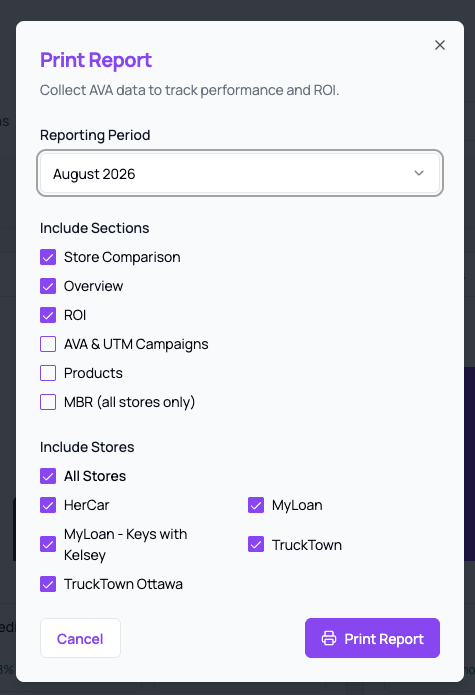
Caption: Pick your period, your sections, and your stores, then export.
Re-capture from a client-role demo account. The PRD version shows real store names AND the MBR section, which clients no longer have.
Export is PDF only today.
Estimated revenue versus actual revenue
Revenue figures come from one of two places.
Actual. If a store has its DMS connected for sales data, the revenue figure is the real number pulled from your system.
Estimated. If a store has no DMS connected, revenue is calculated as vehicles sold multiplied by a flat dealership average profit per sale.
The page labels this everywhere it applies. The caption under Additional Revenue tells you exactly what you are looking at:
| Your stores | What the caption says |
|---|---|
| All connected | Extra revenue this month |
| Some connected, some not | Includes estimated revenue this month |
| None connected | Estimated revenue this month |
Anywhere an estimate appears, you will see a Connect DMS button. Connecting your DMS turns those estimates into measured numbers. See the full list of AVA® integrations to find your DMS.
Sold counts are never estimated. A lead is marked sold either because someone updated it in the portal, or because your connected sales system reported it. Both are real.
Good to know
Sold status and connected systems. If your sales system is connected, sold status updates automatically and cannot be overridden manually in the portal. If it is not connected, your team updates the status by hand.
Expired campaigns. The Expired count in Campaign Pipeline currently shows a dash. That data is not tracked yet.
Single store detail view. The detail page for an individual store runs on an earlier version of this reporting system than the group tabs. The numbers should match. If you ever see a small difference between the two, let us know and we will reconcile it.
Common questions
Where did the Overview page go?
Reports replaced it. Everything Overview showed is on the Overview tab inside Reports, plus more.
I run one store. Is this built for me?
Yes. Reports began as a dealer group feature, then became the dashboard for every company admin. Single stores get the same Overview, ROI, and Campaigns tabs.
Why don't I see the Products tab?
Products compares usage across multiple stores, so it appears for dealer groups only in this release.
Why can't my sales manager see Reports?
Reports is available to Company Admin users only. Member users do not have the tab.
Why is my revenue number labelled as an estimate?
Your DMS is not connected for sales data yet. Select Connect DMS on the ROI tab to start that process.
Can I export as an image instead of a PDF?
Not yet. PDF is the only export format available.
Can I compare two months side by side?
Not today. Reports shows one month at a time.
Can I get a monthly business review summary in the portal?
Not in this release. Your Autocorp representative brings that to your monthly review.
Related articles
Screenshots reflect a sample account. Your own numbers, store names, and enabled products will differ.
Still stuck? Reach out through the chat widget in AVA® Portal, or contact us here.